EXPERIMENTALExperimental model. This model rests on a lot of assumptions: how much a normal year earns against the peak, past memory cycles repeating, the P/E the market pays at each stage, volatility taken from past years, and the KRW/EUR rate. Change any of them and the numbers move a lot. Read them as scenarios, not forecasts. Not investment advice.
SK hynix: an AI boom, priced as a memory cycle
SK hynix makes the high-bandwidth memory that sits next to every AI chip. Its earnings went up about tenfold in two years. The share trades at 2.6× next year's expected earnings, because the market has seen memory booms end before. This page puts twenty years of quarters on one time axis, shows the past cycles, and runs the next five years as 20,000 simulated futures. You can rerun them with your own assumptions.
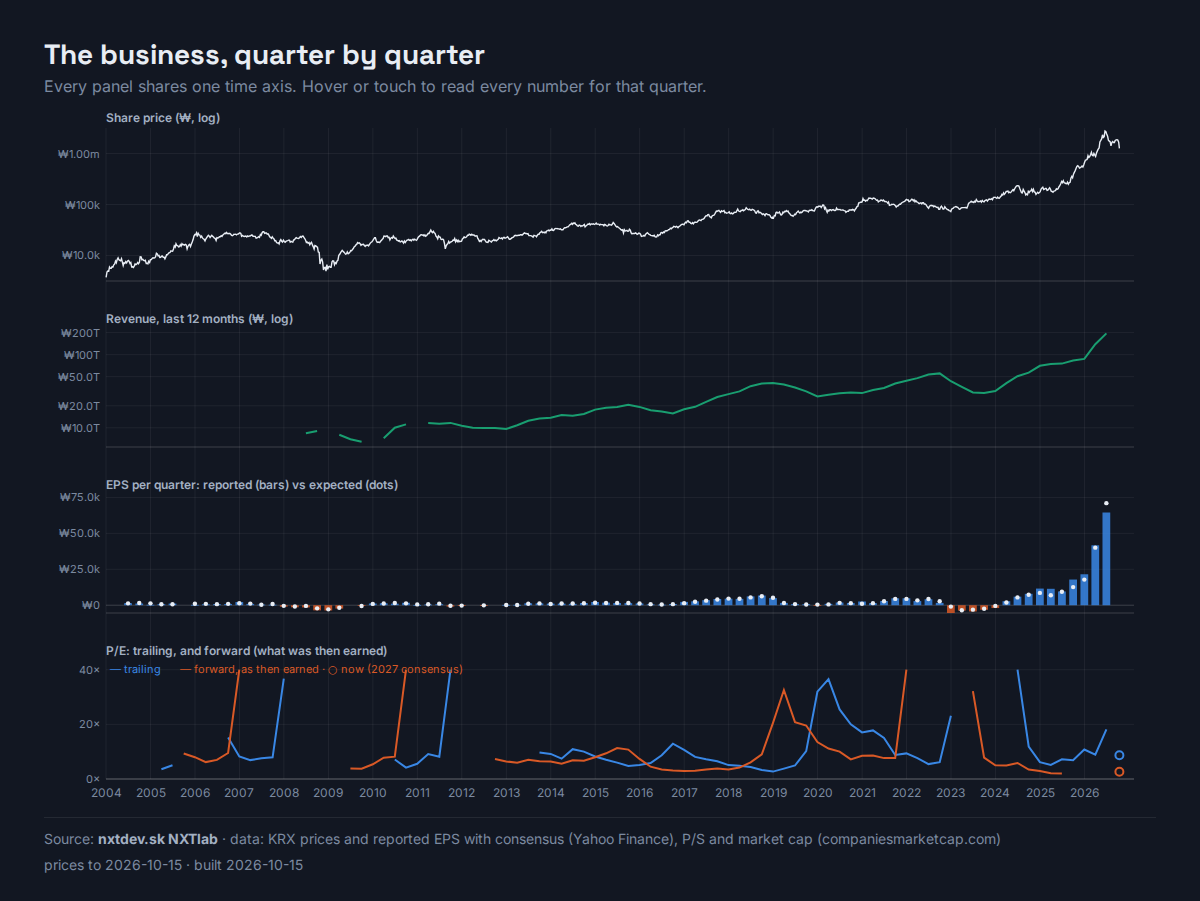
The business, quarter by quarter
Every panel shares one time axis. Hover or touch to read every number for that quarter.
Source: nxtdev.sk NXTlab · data: KRX prices and reported EPS with consensus (Yahoo Finance), P/S and market cap (companiesmarketcap.com)
Price is the Seoul share price in won. It is adjusted for dividends and scaled to today's price, so the line shows total return. It is on a log scale, so the same height means the same percentage move.
Revenue is the last twelve months, in trillions of won, also on a log scale. Growth is that figure against a year earlier.
EPS is each quarter's reported earnings per share (bars), against what analysts expected just before the report (dots). Q1 and Q2 2026 are shown without one-off Kioxia gains (about ₩ and ₩ a share after tax). Most of the Q2 gain is a paper gain on the stake SK hynix still holds, not a sale.
P/E (trailing) is the price over the last four quarters' EPS. Forward P/E (what was then earned) is the price over the EPS of the next four quarters, as it actually turned out. It is a hindsight line: it shows what investors really paid for the coming year's profit. The dot at the end is today's price over analysts' 2027 forecast. P/S is market value over the last twelve months of revenue. Loss years have no P/E, and P/E above 40 is drawn at 40.
Memory is a cycle: the past five
Memory chips are close to a commodity. When prices are high, all three big makers (Samsung, SK hynix and Micron) build fabs, and two years later the extra supply sinks the price. That is why the market pays a low P/E at the top. The table finds each peak in trailing earnings and shows what came next.
"Next 5 years" is the average yearly EPS in the five years after the peak, as a share of the peak's trailing EPS. It is blank where those years run into the AI boom. The price fall runs from the high around the earnings peak to the low before earnings bottomed.
P/E through the cycle, on normal earnings
"Normal EPS" is the average yearly EPS from one earnings peak to the next: one full bust and boom. The last cycle ends in Q4 2024, when trailing EPS first beat the 2022 peak. The P/E columns are the daily share price over that normal EPS within the same span: the median day, and the cheapest day. Trailing P/E cannot do this job, since it is lowest at the peak and near infinite at the trough. 2007–10 lost money on average, so it has no P/E.
The share falls before the earnings do. In four of the five cycles the price peaked while earnings were still rising (in 2010 it peaked six months after), and the P/E at the earnings peak was 3–7×. A low P/E at the top was never a bargain signal by itself.
What normal years earn varies hugely. The five years after a peak earned anywhere from a loss to 1.4× the peak. That one number decides the value of the share today, so the model below draws it at random instead of guessing it.
On normal earnings, the market has paid less than the model assumes. Through the 2010, 2015 and 2018 cycles the median was 4–11× normal EPS, and the cheapest days were 2–7×. Only 2022–24 ran at 27×, as the price began to count on AI and HBM before the earnings came. The model's normal-year P/E of 11–17× sits at the top of the old range: it assumes HBM keeps some of that new rating. The table under "What today's price assumes" shows the answer at the old multiple too.
This time has a different shape. HBM is sold on yearly contracts, tied to AI chips and hard to make, and it is a large part of SK hynix's sales. The bulls say that changes the cycle. The bears point to China's CXMT, more DRAM fabs, and buyers resisting price rises (see HBM demand and China below).
HBM demand, and China's "substitutes" (October 2026)
On 13 October SK hynix fell about 10% in one day, and Korea's KOSPI lost about 18% in five sessions. Two things hit at once: a hot US inflation report that pushed bond yields above 5% and raised doubts about debt-funded AI data centres, and a talk by China's CXMT about a new memory design. Headlines called it a Chinese substitute for HBM. It is not one, but it does matter for one part of the model.
Demand for HBM. It grows with the number of AI chips times the memory on each one, and both are rising: from 80 GB on Nvidia's H100 to 192 GB on the B200 and 288 GB on the newest parts. Google's, Amazon's and Meta's own AI chips use HBM too, so Nvidia losing share does not shrink it. HBM also takes about three times the wafer area per bit of ordinary DRAM, which is why it makes all memory scarce. Forecasts differ widely (JPMorgan: about $64B in 2026, $160B in 2027, $280B in 2028, with supply 16–20% short each year). Most 2027 output is already under contract: Micron over 75%, Samsung about 80%, and SK hynix has deals of around five years with more than ten customers.
What China actually has:
What
What it really is
Threat to SK hynix
CXMT HBM3
Real HBM, about two generations behind (HBM3 vs HBM4). Mass production has slipped past 2026, with reported yields of 25–50%. About 2 million stacks in 2026, enough for some 250–300 thousand Huawei chips.
Low. It only sells in China, which US export rules closed to Korean HBM in December 2024.
Huawei HiBL / HiZQ
Huawei's own HBM-type stacks (1.6–4 TB/s), still built from CXMT DRAM.
Low. HBM by another name, with the same limits.
LPDDR in Ascend 950PR
Cheaper, slower phone-type memory in place of HBM. Fine for some inference, weaker for training.
Low–medium. Nvidia does the same for some steps, so HBM moves to where bandwidth matters most.
Huawei UCM software
Moves the AI inference cache between HBM, DRAM and SSD. The claimed gains (up to 22× throughput) are unverified.
Low. Western stacks do the same. Cheaper tokens usually mean more tokens, not less memory.
CXMT 4F² DRAM (the 9–10 Oct talk)
Not HBM: a denser DRAM cell (30–50% more bits per area, per TrendForce), aimed at server memory by the end of 2026. No speeds, yields or volumes published.
The one to watch, but slow. It threatens ordinary DRAM prices when the cycle turns, not HBM in 2027.
Nobody has replaced HBM. China has workarounds because it is cut off from it, and they stay in a market Korean HBM had already lost. Most analysts called the 13 October fall an overreaction: announcing a design is not making it in volume.
2026–27 earnings look safe; 2028 is the question. That is when the new fabs of all three makers come in, Samsung catches up on HBM4, and AI spending may slow, the worry behind this week's fall. Long contracts turn price risk into renewal and customer-credit risk; some of the buyers, like CoreWeave and Oracle, are the ones borrowing.
How it fits the model. None of this changes the 2027 peak. It all lands on the normal-year earnings range and the chance of an AI-spending pause, the two draws the scenarios below are sorted by. If you think CXMT turns DRAM into a price war after 2028, move "Normal-year earnings" down in Run it yourself (after the 2018 cycle it was about 12% of the peak); if you think HBM contracts hold, move it up. A worried view of AI financing is a higher "Chance of an AI-spending pause".
20,000 futures: the share price over the next five years
5–95% of paths25–75%MedianAverageSample pathsActual price
Model: nxtdev.sk NXTlab · memory-cycle Monte Carlo, shared AI factors with GOOG and NVDANot investment advice
Three kinds of future, and how often the model lands in each
The scenarios are not separate forecasts. They are buckets of the same 20,000 paths, sorted by the two draws that matter most: how much SK hynix earns in normal years once the boom fades, and whether and when AI data-centre spending pauses (the model gives that a 15% chance each year).
What today's price assumes
Two judgements at once: how much normal years earn, and what the market pays for them (5-year return a year: average / median)
Each cell reruns the model with only these two dials changed: average return a year over 5 years / median (typical) return a year. "Pre-AI" is the median P/E on normal earnings of the 2010, 2015 and 2018 cycles (9.3×), ±2. "AI era" is the 2022–24 cycle, which ran at 17–27× as the price began to count on HBM. The model's base is the middle cell.
Next to Google, Nvidia and a world index
The same simulation also prices Alphabet and Nvidia from their own business models, on the same random AI-cycle draws, and a global all-cap index fund (VALL-type) from 50 years of index history. The outcomes are for €10,000 at constant exchange rates, after Slovak tax (gains on shares held over a year are tax-free).
The average return includes the rare huge winners; the median path is the typical outcome. Max drawdown is the worst peak-to-trough fall along the way. Sharpe is the return above euro cash (2%) per unit of risk, per year. SK hynix's simulated spread matches its 5-year history (55% a year); the last 12 months were rougher (91%).
Run it yourself
The same model, running in your browser. Move a slider and the futures are re-drawn; "Watch it run" plays them month by month.
Where €10,000 ends up after 5 years
Same engine as the chart above, re-implemented in JavaScript; numbers differ from the table by sampling noise only
How the model works
Earnings as a cycle. 2027 is the peak, centred on the analyst consensus (₩ per share, ±25%). Each later year moves 55% of the way toward a "normal-year" level. That level is drawn at random as 20–50% of the peak, and moves with a shared AI-demand factor (strong AI demand lifts it). In a year when AI spending pauses, earnings drop to 12% of the peak.
Price. Each September the share is worth a P/E times "normalized" earnings (65% normal-year level, 35% current earnings), plus net cash per share valued at 85%. Today's price implies a P/E of × on that basis. Over time it drifts toward a normal-year P/E of 11–17× (half the gap closes every two years), with year-to-year noise, and is cut by a quarter in an AI-spending pause.
Cash. 60% of each year's profit becomes net cash (after capex, tax and dividends). On the median path five years add about ₩ of net cash a share, of today's price, which is why even weak futures keep a floor.
Shared draws. The AI-demand factor, the timing of an AI-spending pause and the market's mood for multiples are drawn once per path and shared with the Alphabet and Nvidia models. Within each year, monthly prices follow a random bridge between the yearly values.
Inputs: price ₩ (), consensus EPS 2026–28 (MarketScreener), net cash ₩T (₩69.4T in the Q2 2026 release, plus a quarter's retained profit, less the ₩40T buyback) on m shares after the buyback's cancellation. The 2026 EPS used excludes the Kioxia gains.
What it leaves out
The won/euro exchange rate is held constant; buying the US-listed SKHY adds the dollar on top.
The Korea discount (cash that may never reach shareholders) only enters through the 85% cash value. In August SK hynix approved a ₩40T buyback and cancellation, the largest in Korea, and raised its payout target to 50% or more of free cash flow; the model counts that buyback but no later ones.
The ~14% Kioxia stake still held through convertible bonds is left out. At recent Kioxia prices it is worth tens of trillions of won, a few percent of SK hynix's market value, and it swings with Kioxia's share price.
China's memory makers enter only through the normal-year range (see HBM demand and China). If CXMT turns DRAM into a price war, the lower sliders are the right ones.
The model's biggest judgement is the normal-year earnings range. History alone (the 2018 cycle: about 12%) gives a 5-year average return near +7% a year; the bulls' range (35–60%) gives about +22%.
This is a model, not a forecast or advice. It is built to show which assumptions matter and how much risk comes with each, not to say what the price will be. Data and model code: the NXTlab ai-leaders-eval repository.