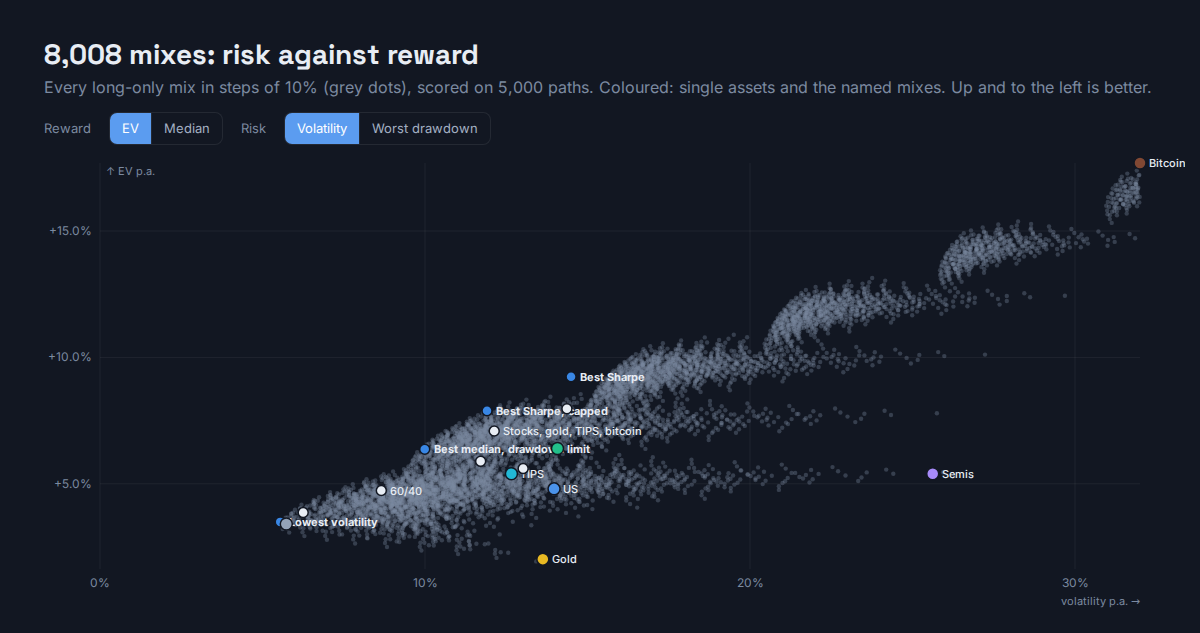
Power of uncorrelated assets in portfolioEXPERIMENTAL
Why two unrelated assets beat either one, with a toy to play with. Then seven real assets in EUR: US and European stocks, semis, gold, euro bonds, bitcoin and a 30-year US TIPS, measured and simulated together. The best mix beats every asset alone, roughly doubling the Sharpe of the best single one, and you can build and test your own.
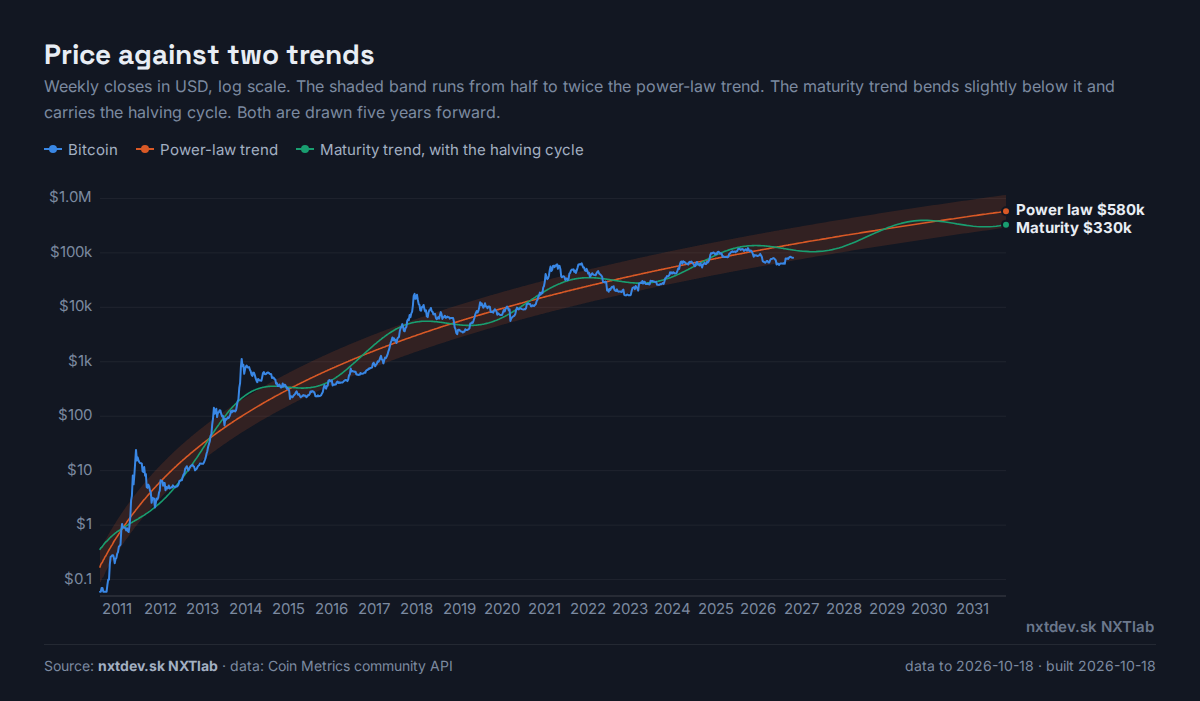
Bitcoin: four models, scored on the pastEXPERIMENTAL
Power law, decaying growth, a scenario table and a new maturity model, each forecast from every month-end since 2013 with only the data known that day. The maturity model scored best, and the blend is weighted by that score. At €72k bitcoin sits at 0.64× its trend, below the €82k three-year buy-below price.
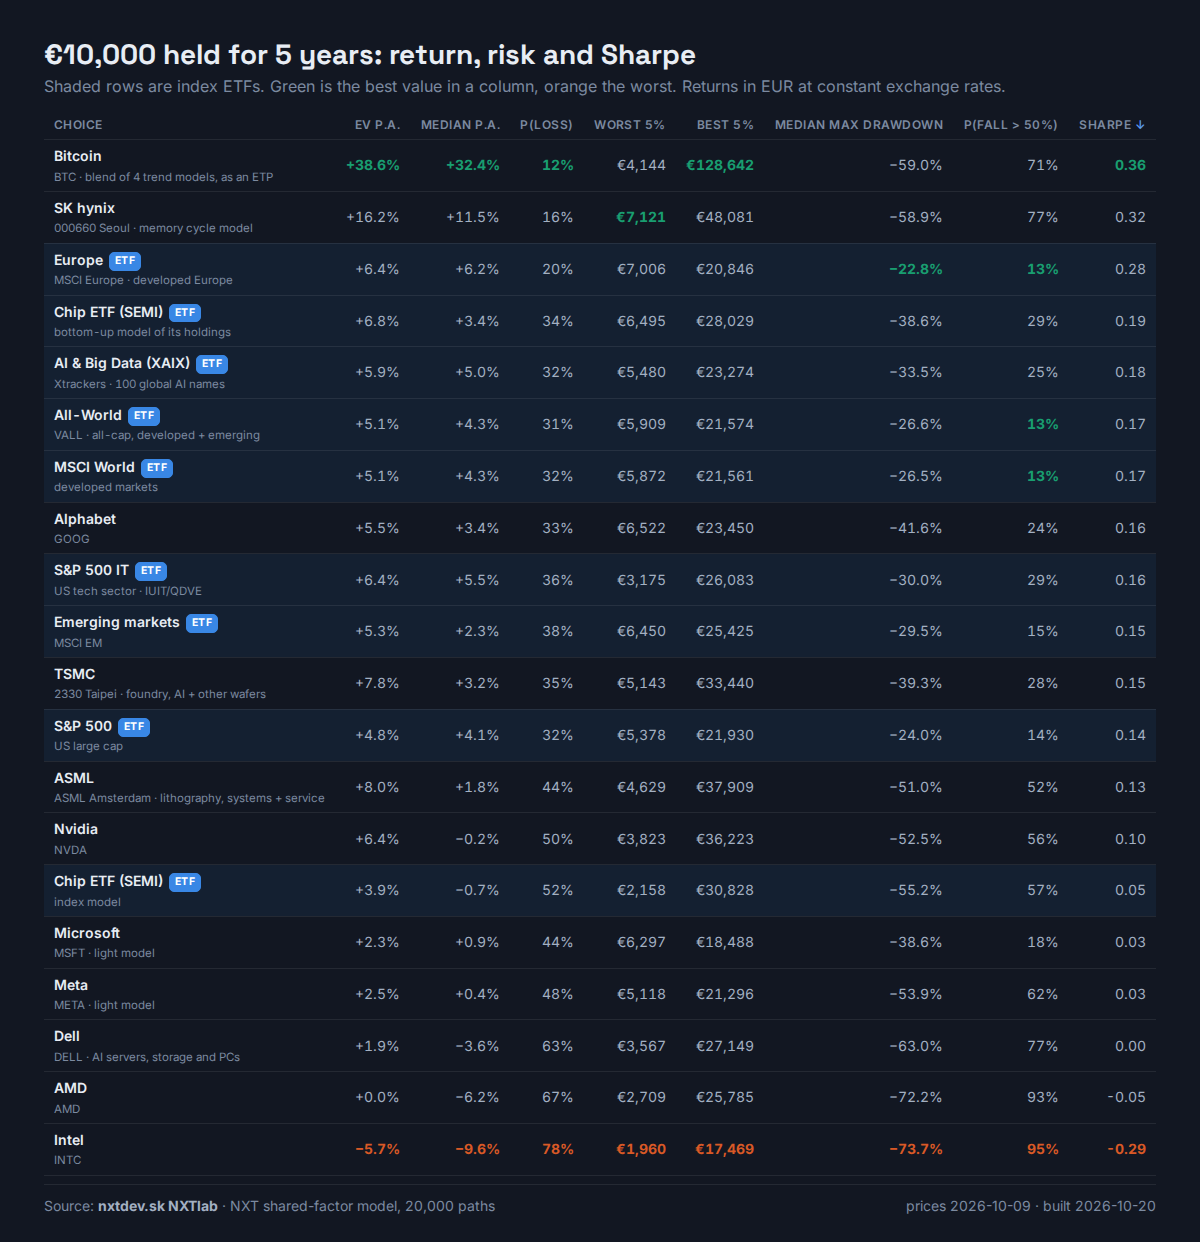
ETFs vs AI stocks: one Monte Carlo modelEXPERIMENTAL
€10,000 into each of twenty choices, 20,000 simulated futures each: eight index ETFs (world, US, Europe, emerging markets, US tech, an AI fund, chips), ten AI stocks and bitcoin. Over 5 years the broad funds give about what Alphabet and Nvidia do, with much smaller falls on the way. Only SK hynix and bitcoin clear the ~9.7% a year stock risk should pay.
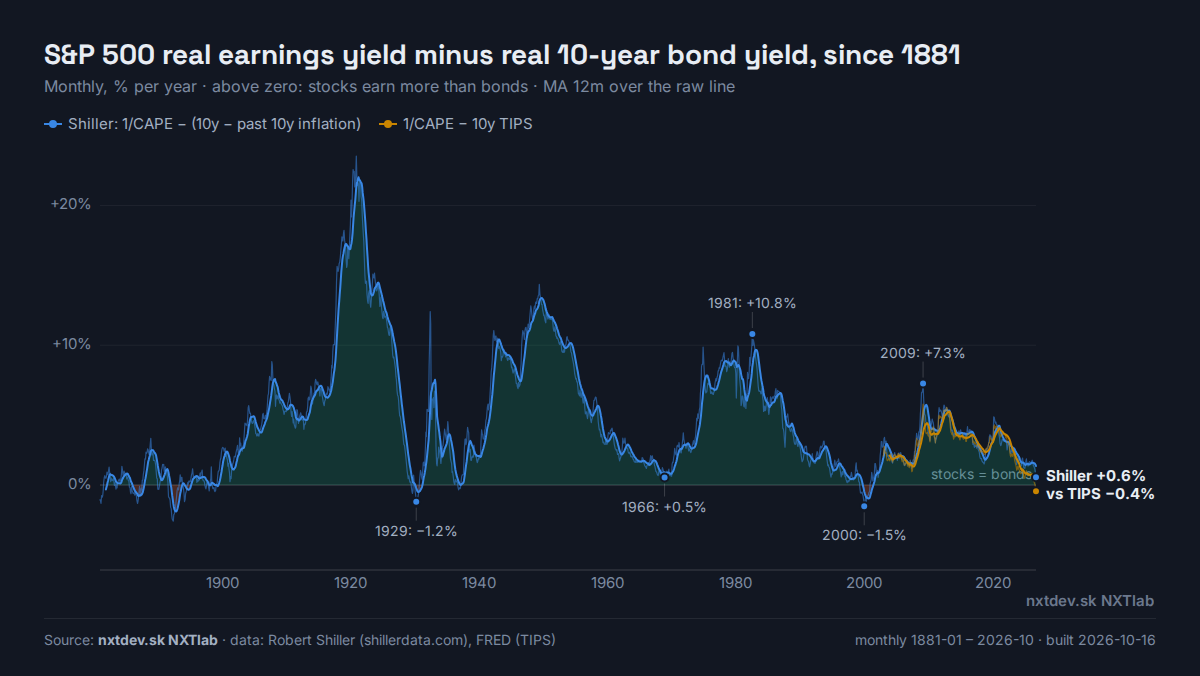
Stocks vs bonds: the S&P 500 barely out-earns the 10-year Treasury
1/CAPE minus the real 10-year yield since 1881: positive in 93% of months, now +0.6%, the smallest since 2002, and below TIPS for the first time. Only 164 of 502 S&P 500 stocks earn more than the 10-year's 5.2%.
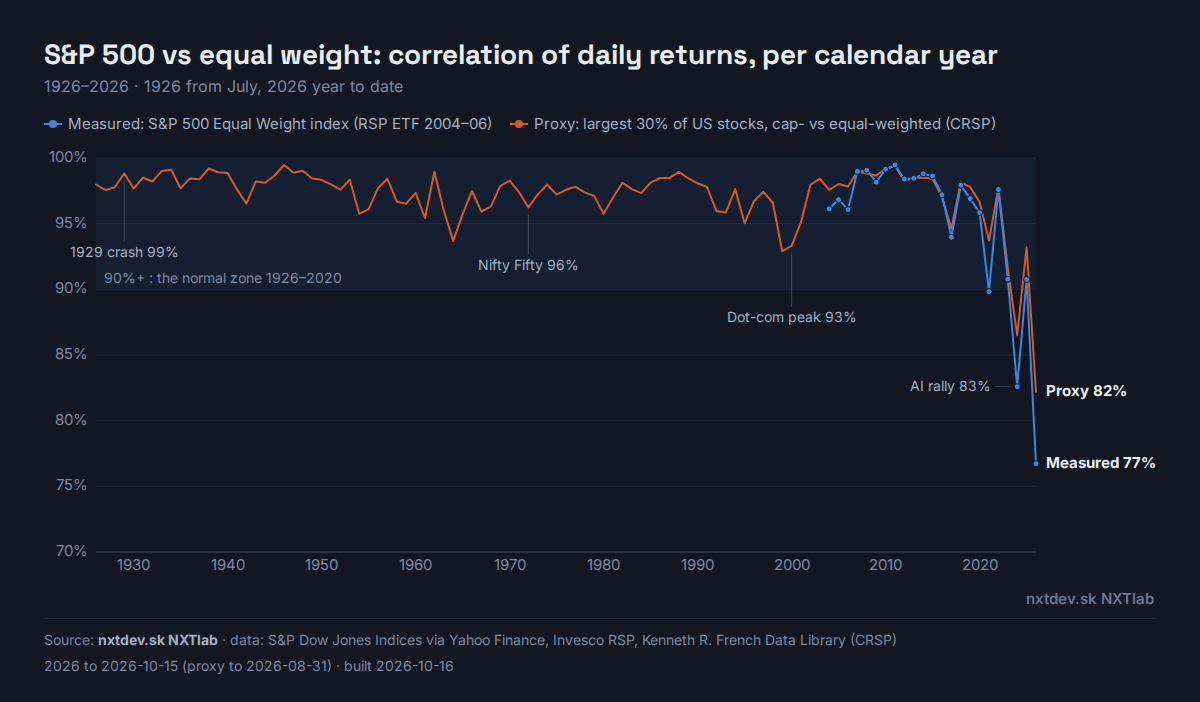
The S&P 500 and its equal-weight twin: the lowest correlation in 100 years
From 1926 to 2020 the daily-return correlation never fell below 93%, through the Depression, the Nifty Fifty and the dot-com bubble. In 2026 it is 77%, the lowest in 100 years. Why that makes equal weight US stocks with little AI, and what it does not protect against.
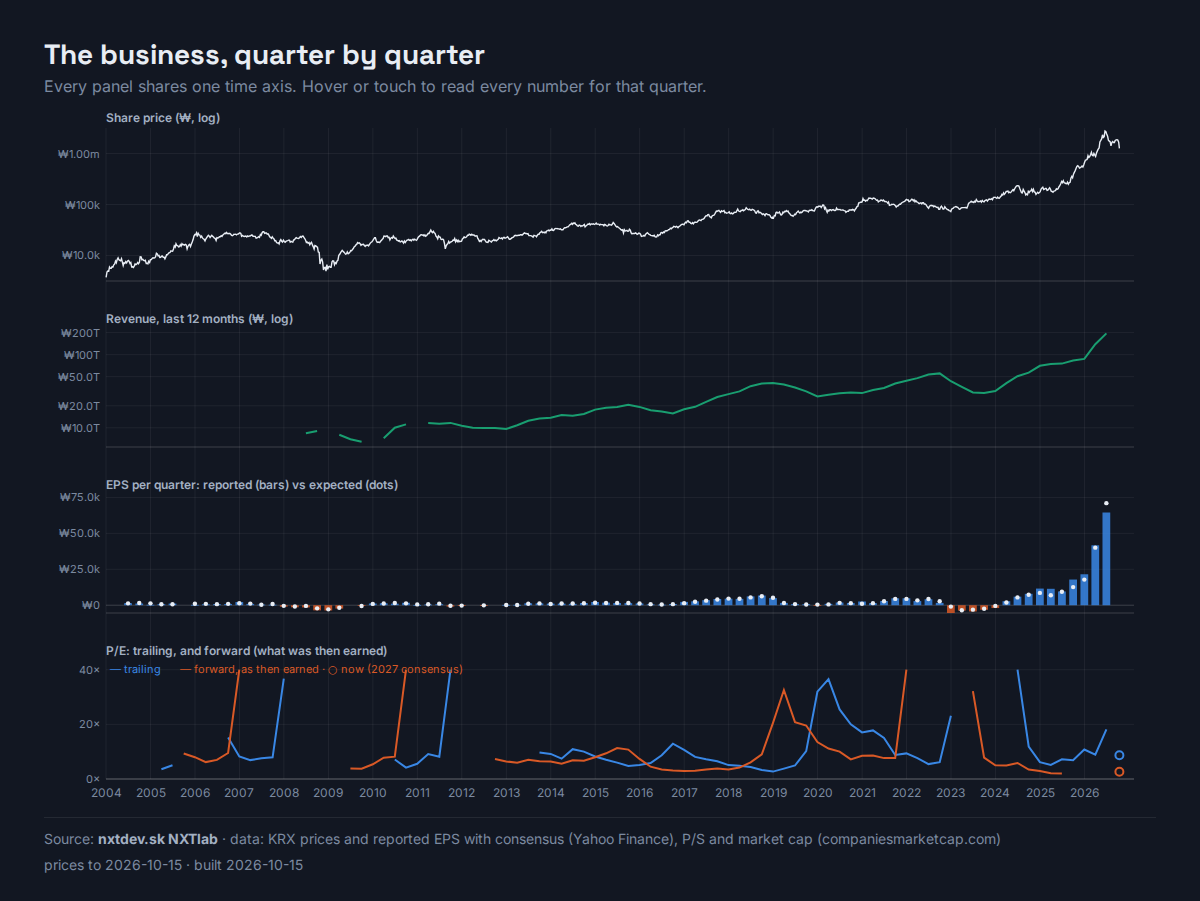
SK hynix: an AI boom, priced as a memory cycleEXPERIMENTAL
Twenty years of quarters on one chart, five past memory cycles, and 20,000 simulated futures you can rerun in the browser. At 2.6× 2027 earnings, the price is fair if normal years earn about 23% of the peak.
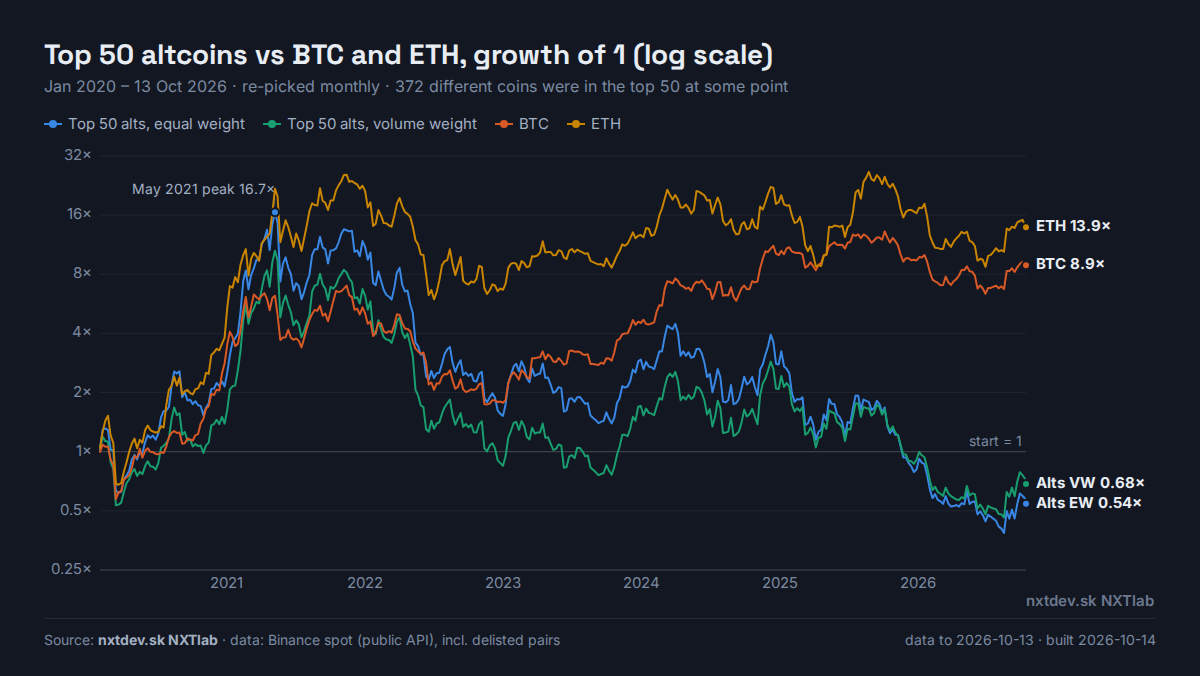
The 50 most-traded altcoins: up 16× by 2021, down 97% since
Re-picked every month, dead coins included: the basket is worth 0.54× its February 2020 value while BTC is at 8.9×. Of each January's top 50, only 4–10% beat BTC to today.
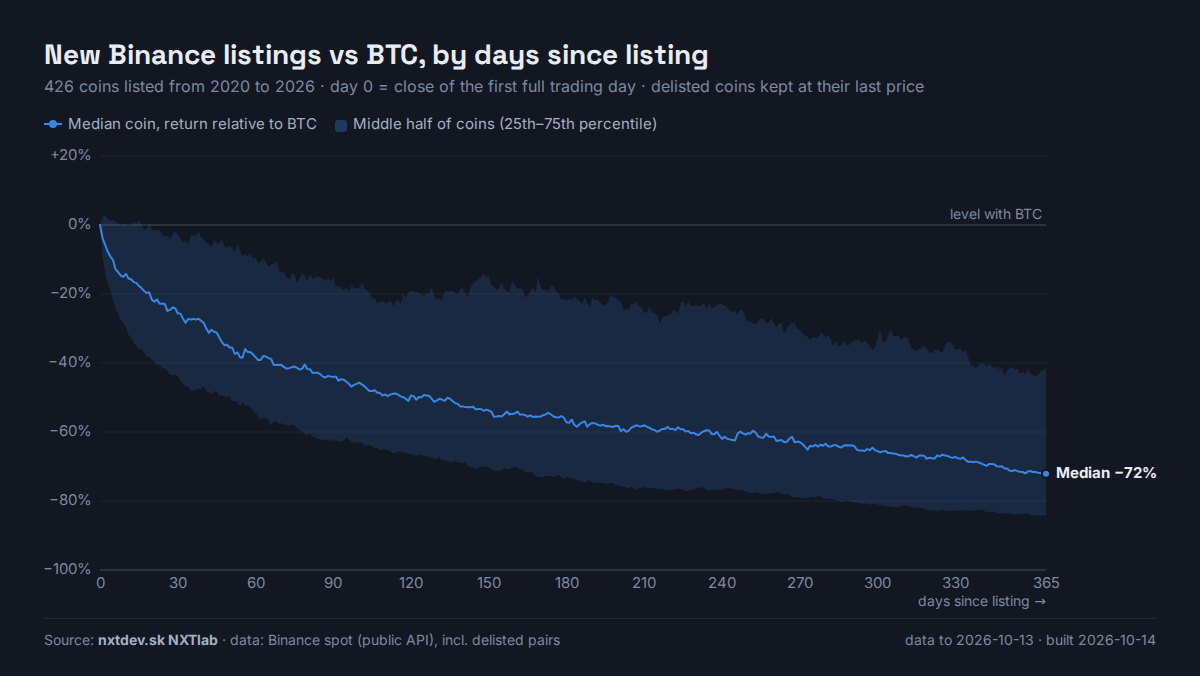
New Binance listings: the median coin trails BTC by 72% after a year
426 new coins since 2020, delisted ones included. About 1 in 7 beat BTC over its first year, none of the 56 listed in 2024 did. Plus the slide before a delisting.
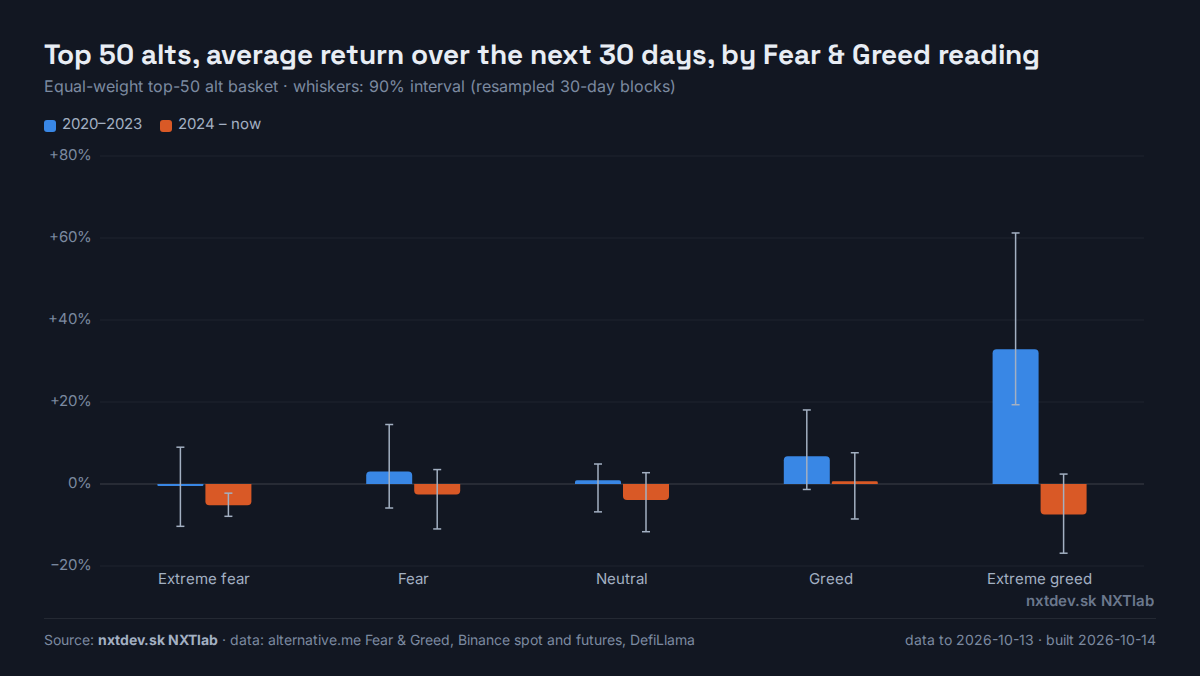
Fear & Greed is mostly the price, and its signal flipped in 2024
Extreme greed came before +33% in alts over 30 days in 2020–2023 and −7% since. Next to BTC's own trend, Fear & Greed, funding and stablecoin supply add nothing.
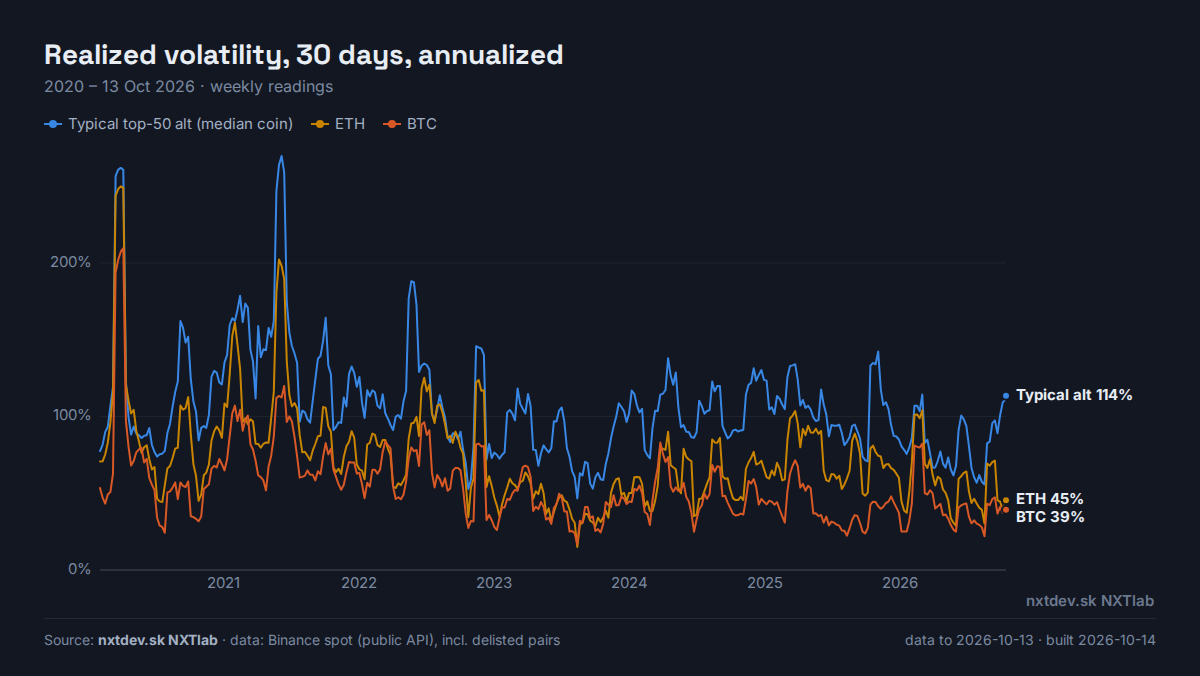
Altcoins: twice BTC's volatility, and an altseason that stopped coming
The typical top-50 alt swings 1.7–2.6× as much as BTC and moves with it. 75%+ of alts beat BTC on 86 days in 2021 and on 5 so far in 2026. With BTC implied vs realized volatility.
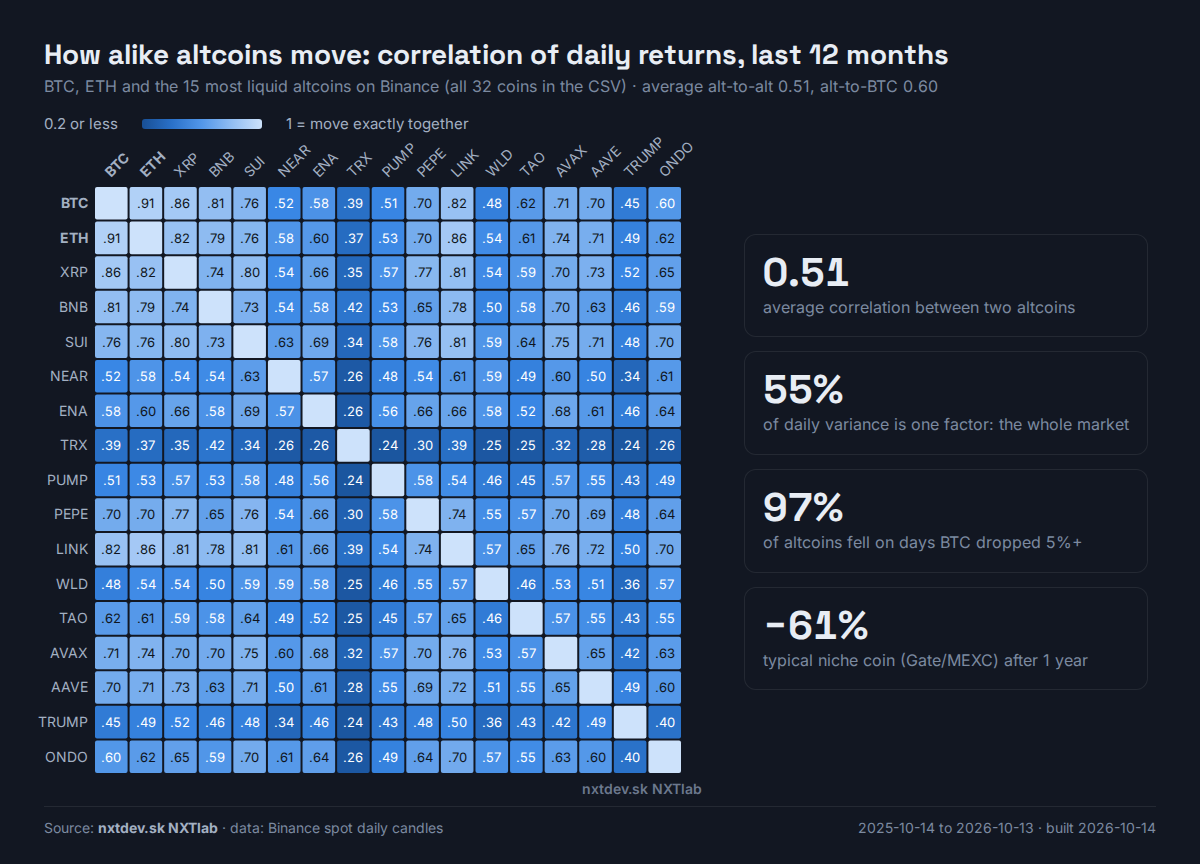
Altcoins are one bet, and niche coins are a lottery
One market factor drives most of every altcoin's daily move, and 97% of alts fall on BTC's bad days. Among 1,143 coins listed only on Gate and MEXC, the typical one lost 61% in a year, and only a few big winners keep the average near zero. With max drawdown, mean, median, p5 and p95.