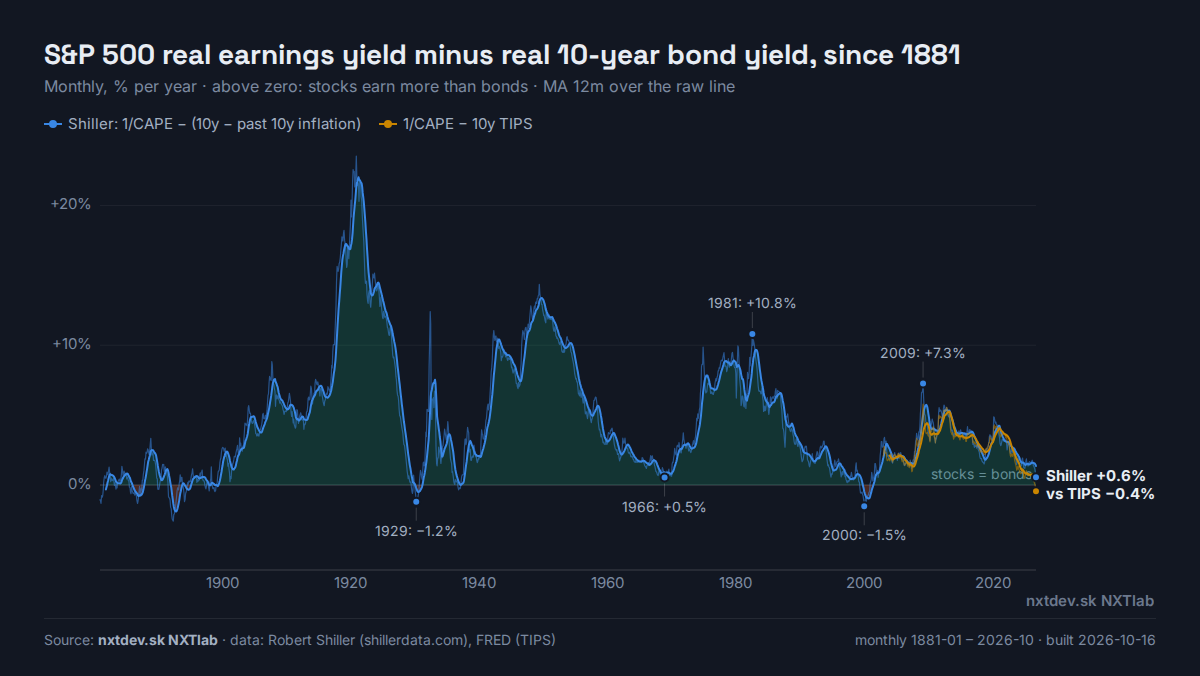
Stocks vs bonds: the S&P 500 barely out-earns the 10-year Treasury
For each $100 in the S&P 500, the companies earn about a year in real terms. A 10-year Treasury pays , which is about after inflation. Stocks used to pay you extra for their risk. Since 1881 that extra was positive in of months. Today it is the smallest since 2002, and against inflation-protected bonds it has turned negative for the first time.
Excess CAPE Yield = 1/CAPE − real 10-year yield
CAPE is the price of the S&P 500 divided by its average earnings over the past 10 years, each year adjusted for inflation. Ten years smooths out booms and recessions. Turned upside down, 1/CAPE is a yield: what $100 of the index earns in a normal year. Company earnings grow with prices, so this is a real yield.
A bond's coupon is fixed in dollars, and inflation eats it. So the fair comparison is the bond's real yield. The long line (Robert Shiller's method) uses the 10-year yield minus the past 10 years' inflation. From 2003 the second line uses the market's own real yield, the 10-year TIPS. Above zero, stocks earn more than bonds. Below zero, you take stock risk for less than a safe bond pays.
Smoothing From
S&P 500 real earnings yield minus real 10-year bond yield, since 1881
Source: nxtdev.sk NXTlab · data: Robert Shiller (shillerdata.com), FRED (TIPS)
The gap is small because both sides moved. 1/CAPE fell as prices rose faster than earnings (CAPE about 41). Real bond yields climbed from below zero in 2021 to about 3% today.
% per year: over 12 months, and averaged over the past 10 years
The popular version: earnings yield minus the nominal 10-year
Trailing 12-month E/P − 10y Treasury · earnings to
The popular version (the "Fed model") compares a real yield with a nominal one. It works passably when inflation is low and steady. In 1981 it said stocks were dear (gap about −2.4%), when CAPE was 8 and stocks were the bargain of the century: high inflation had pushed bond yields up, and earnings would grow with it. It is shown because it is the one most people quote.
Did the gap tell you anything?
Each month since 1881 is grouped by its Excess CAPE Yield. Then we measure what happened over the next 10 years: the real return of stocks minus the real return of 10-year bonds, per year (Shiller's series, with dividends and coupons reinvested). The last start month with a full 10 years is .
Next 10 years: stocks minus bonds, real, % p.a.
Average by the Excess CAPE Yield at the start
Each January: the gap vs the next 10 years
This is a 10-year signal, not a timing tool. In 1997 the gap was already near today's level, and stocks still rose for three more years before 2000–2009 handed the gains back. The "below 0%" row comes almost all from 1929–30 and 1999–2002, so it rests on two episodes.
S&P 500 returns by the gap at the start
The same months, in finer bands, now looking at the S&P 500 alone: its real return (after inflation, dividends reinvested) over the following 1, 3, 5 and 10 years, averaged over every month that started in the band. "When" lists the stretches of 9 months or more the gap spent in the band. The bar shows the span of 10-year returns, from the worst to the best start month, with the dot at the average.
Today: how many S&P 500 stocks earn more than the 10-year?
For each member, the earnings yield is earnings per share over the last 12 months divided by the price (1 / P/E). We compare it with two hurdles: the 10-year Treasury at (nominal, P/E below ) and the 10-year TIPS at (the real yield, P/E below ). The real hurdle is the fair one, because a stock's earnings grow with inflation and a bond's coupon does not.
S&P 500 members by earnings yield
share of stocksshare of index value
By sector
The 15 biggest members
What it shows
The equity premium is about gone. On Shiller's measure the gap is , lower than in of months since 1881. Other times this low: the 1880s–90s (prices were falling, so bonds' real yield was high), 1929–30, 1936–37, 1968 and 1997–2002.
Against TIPS it is below zero () for the first time since TIPS data begins in 2003. A 10-year TIPS locks in about a year above inflation, with no earnings risk.
Low gaps came before poor decades for stocks relative to bonds. From a gap below 2%, stocks beat bonds by a year on average over the next 10 years. From above 4%, by .
Most stocks do not beat the 5.2% bond. Only of the S&P 500's members earn more than it on the last 12 months. Against the real hurdle, most do. Of the 15 biggest, clear 5.2%; do not even clear the TIPS yield.
The index's forward yield does clear the bond. On analysts' next-12-month earnings the cap-weighted index yields , against on the last 12 months. Part of that gap is expected growth. Part is that analysts' forecasts leave out one-off costs that reported earnings include.
Not investment advice. A low gap says the expected reward for owning stocks over bonds is small for the next decade. It does not say when, or whether, prices fall.
Method
Robert Shiller's monthly data (shillerdata.com): S&P Composite price (monthly average of daily closes), earnings, dividends, CPI, the 10-year Treasury yield and CAPE. The latest month uses an early-month close, and Shiller estimates his last earnings and CPI.
Real 10-year yield, long series: the 10-year yield minus annualised CPI inflation over the past 10 years, as Shiller builds his Excess CAPE Yield. Our series matches his published column to the fourth decimal in all months. From 2003 we also use the 10-year TIPS yield (FRED DFII10, monthly mean), which is the real yield the market actually pays.
Next 10 years: Shiller's annualised real excess return, meaning stocks (dividends reinvested) minus 10-year bonds (coupons reinvested), both adjusted for inflation.
Today's members: Wikipedia's S&P 500 list. Prices, trailing and forward earnings per share, dividends and market value come from Yahoo Finance on . Earnings are as reported (GAAP). Members with losses count as not beating. Index-value shares use full market value, not S&P's float-adjusted weights.
Smoothing is computed in your browser: a trailing moving average (MA) or exponential moving average (EMA) over the chosen number of months. The raw monthly line stays visible behind it.