Fear & Greed is mostly the price, and its signal flipped in 2024
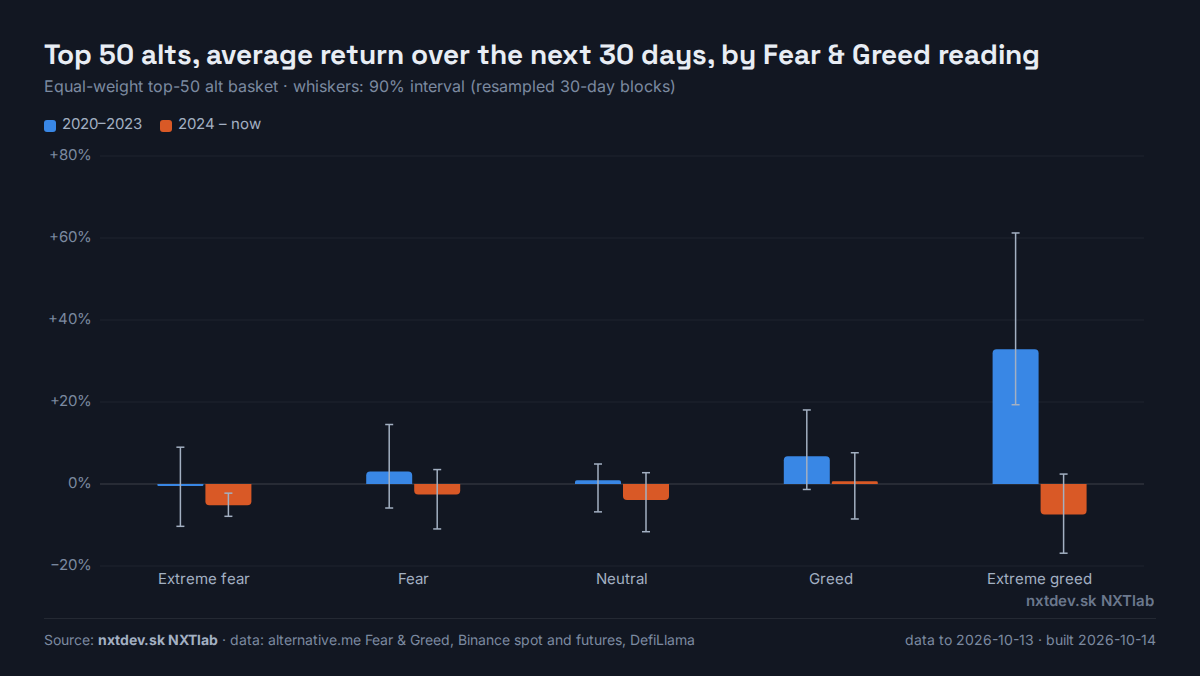
"Buy fear, sell greed" sounds wise. From 2020 to 2023, alts actually did best right after extreme greed. Since 2024, that same reading has come before losses. We tested three sentiment readings: Fear & Greed, perpetual funding and stablecoin supply. Once you know BTC's own 30-day trend, none of them tells you anything more.
Top 50 alts, average return over the next 30 days, by Fear & Greed reading
For each reading: the change in the next 30 days' return for a one-standard-deviation higher reading. It is measured once on its own, and once next to BTC's 30-day return and volatility, which anyone can read off a chart. A reading passes only if, next to the price, its effect points the same way in both periods and is significant over the whole sample (|t| ≥ 2, Newey-West errors for the overlapping windows).
Fear & Greed vs BTC's own 30-day return, weekly
Every reading, zone by zone
Average return of the top-50 alt basket over the next 30 days.
Funding is the median annualized perpetual funding rate across the month's top 50 alts. Binance's base rate is 0.01% per 8 hours (about 11% a year), and most days sit right there. Stablecoin supply is the 30-day growth of all USD stablecoins, in fifths of its 2020–2026 range. BTC trend is BTC's own 30-day return, in fifths. It is shown as the yardstick: the price did the same thing, and it is free.
Positioning, recorded from now on
Binance serves open interest and the long/short account ratio for the last 30 days only. We started recording them daily on , so this history will grow. It will be tested once there is enough of it.
Open interest, 60 most-traded USDT perpetuals, USD
What it shows
Fear & Greed mostly repeats the price. Its correlation with BTC's past 30-day return is . Put the price next to it and its own effect disappears.
"Buy extreme fear" did not work for alts. After extreme fear, the basket fell on average in both periods. Since 2024 the 90% interval sits entirely below zero.
Hot readings flipped sign. Extreme greed, funding above the base rate and fast stablecoin growth all came before strong 30-day gains in 2020–2023 (trend-following worked), and before losses since 2024. A rule fitted on the first period would have lost money in the second.
The price itself flipped too. The best fifth of BTC trends came before +23% in alts in 2020–2023, and about +4% since. This is less a sentiment story than the alt market losing its momentum after 2021 (see altseason).
Method
Readings at each day's close (UTC), 2020–2026. Fear & Greed comes from alternative.me (daily, built partly from BTC volatility and momentum). Funding comes from Binance USD-M perpetuals. Stablecoin supply comes from DefiLlama (all chains).
The outcome is the return of the equal-weight top-50 alt basket over the next 30 days (survivorship-free, re-picked monthly; see the top 50 alts page). The same tests on BTC's own next 30 days are in the data file. None passes there either.
The windows overlap day by day, so zone intervals resample whole 30-day blocks, and regression t-statistics use Newey-West errors with 30 lags.
The split at 1 January 2024 was fixed before looking. A pattern that holds in only one period is not a pattern.