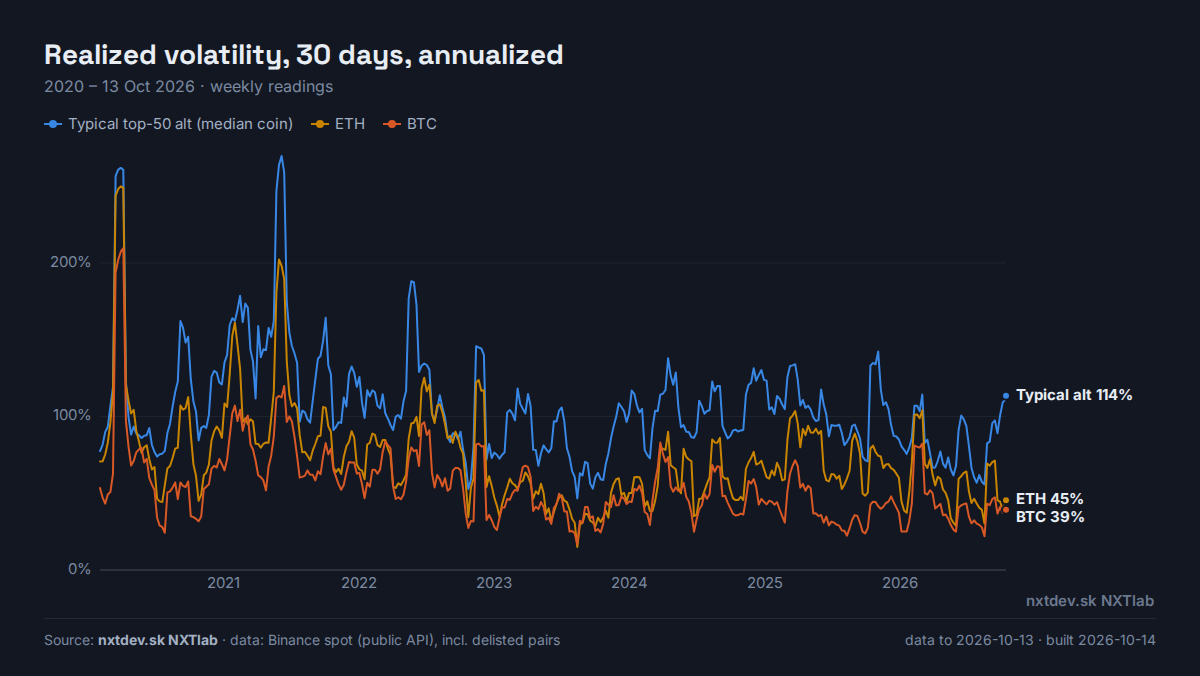
Altcoins: twice BTC's volatility, and an altseason that stopped coming
The typical coin in the top 50 alts swings about twice as much as Bitcoin, and it moves with Bitcoin most of the time. "Altseason" means 75% of the top 50 beating BTC over 90 days. That happened on 86 days in 2021, and on 5 days so far in 2026.
Altseason gauge: share of the top 50 alts beating BTC over the last 90 days
Above 75% is the usual definition of altseason. The top 50 is re-picked monthly and includes coins that later died.
How closely alts follow BTC: 90-day correlation of daily returns
The typical coin in the top 50, and the equal-weight top-50 basket.
Typical top-50 alt (median coin)Top 50 basket
BTC: implied volatility (Deribit DVOL) vs the volatility that followed
DVOL is the options market's 30-day forecast. The second line is BTC's realized volatility over the next 30 days, plotted on the day of the forecast.
Implied (DVOL)Realized, next 30 days
Year by year
Volatility and correlation are the medians of the daily readings in each year. Altseason days are days with 75% or more of the top 50 ahead of BTC over 90 days. 2020 starts in late March (the first 90-day window), and 2026 is the year to date.
What it shows
One alt is not a diversified bet. The typical top-50 coin has run at 80–140% annualized volatility, 1.7 to 2.6 times BTC's (by year). The basket of 50 is calmer than the typical coin, but it still moves more than BTC.
Alts mostly follow BTC. A correlation of 0.5–0.7 for single coins, and around 0.8 for the basket, means most of an alt's move is a leveraged BTC move. Correlation rises in sell-offs, as in 2022, which is exactly when diversification would help.
Altseason has faded. It hit 86 days in 2021, then 5 in 2023, 28 in 2024, 14 in 2025 and 5 so far in 2026. The fade shows up whether the window is 30, 90 or 180 days. What we can measure behind it: money left alts for BTC. On Binance, alt trading volume was 4–6 times BTC's in 2021 and 2024, and is about 1.8 times now. Over the same years the number of alts trading there more than doubled, from 178 to about 400. Whether more tokens also thinned out the rallies we cannot show: the top 10 alts take about the same share of alt volume as before.
Options usually overprice BTC's next month. Implied volatility was above the realized volatility that followed on about 72% of days, by about 8 points on average. That is the usual premium for selling insurance. It reverses in shocks, and those are the days that matter for anyone short options.
Method
Daily closes (UTC) built from Binance 4-hour spot bars, with delisted pairs kept. The top 50 is the 50 most-traded alts of each month by median daily USDT volume over the 30 days before; see the top 50 alts page.
Realized volatility is the standard deviation of daily log returns over 30 days × √365. "Typical alt" is the median across that month's top 50.
Correlation is computed over 90 days of daily returns against BTC, for each member, then the median is taken.
DVOL is Deribit's 30-day implied volatility index for BTC (daily close, from March 2021).
All windows look backward from the day, except the "realized, next 30 days" line, which is the outcome and is plotted on the day of the forecast.