The 50 most-traded altcoins: up 16× by 2021, down 97% since
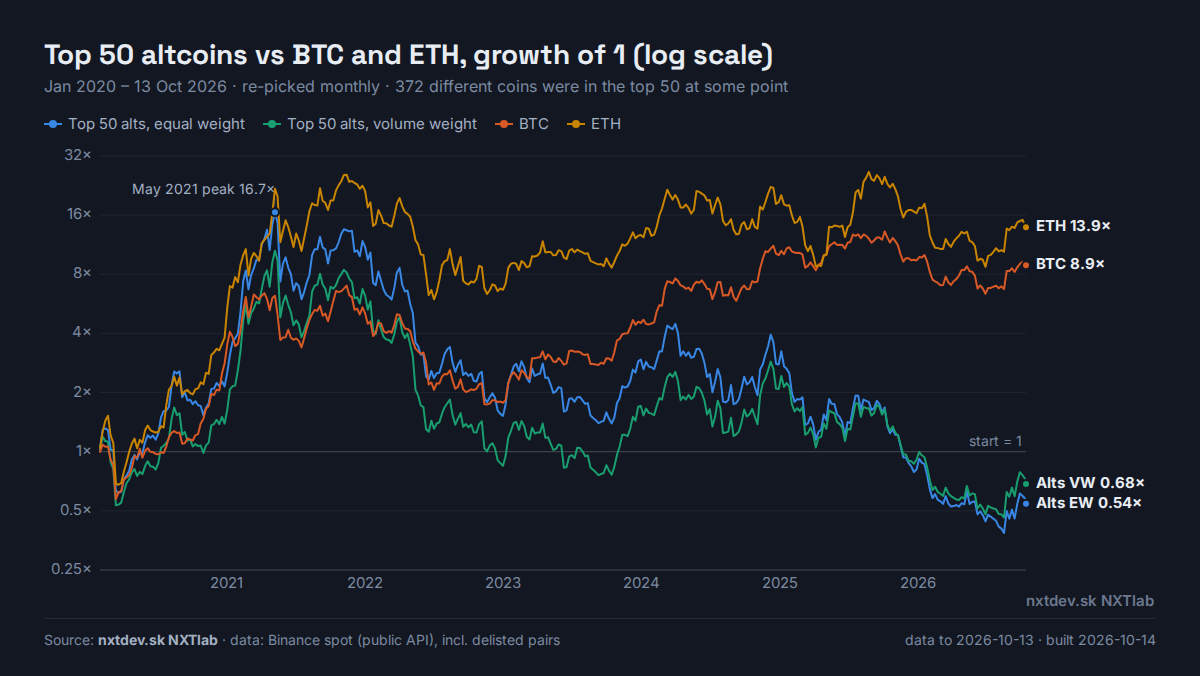
Take the 50 most-traded altcoins on Binance, re-pick them every month and keep the ones that later died. That basket rose 16-fold by May 2021. Today it is worth 0.54× what it was in February 2020. Bitcoin is at 8.9×.
Top 50 altcoins vs BTC and ETH, growth of 1 (log scale)
Top 50 alts, equal weightTop 50 alts, volume weightBTCETH
Buy the 50 most-traded alts on the first day of the year and hold them until today. Coins that moved to a new token through a swap count as still alive.
Return to today is the total over the whole holding period, not per year. "Lost 90%+" is the share of coins down 90% or more. The 2026 group has been held for under a year.
Year by year
Calendar-year returns. 2020 starts 31 January (the first month with a ranking window), and 2026 is the year to date.
What it shows
The alt market made one big run and gave all of it back. The basket rose 16-fold from early 2020 to May 2021. It then lost 97%, and no cycle since has come close to that peak.
Picking "the big ones" did not protect anyone. In each January from 2020 to 2025, only 2 to 5 of the top 50 (4–10%) went on to beat BTC. In most of those years the median coin lost more than 60%.
The averages hide the shape. In the 2020 group the average coin is up about 3.9×, but the median coin is down a third. A handful of big winners pull the average up while most coins lose.
Survivorship is the trap. Most alt index charts show only the coins that exist today. Here, 12–20% of each early top 50 no longer trades on Binance at all, and fewer than half are still in the top 50.
Rebalancing costs are small next to all this. About a quarter of the basket changes every month. At 0.4% per round trip, that costs about 8% of the final value over six and a half years.
Method
Universe. Every USDT spot pair Binance ever listed since 2020, including delisted ones: about 680 pairs, in 4-hour bars joined into UTC days. The universe excludes BTC and ETH (they are the benchmarks), wrapped and staked copies, gold tokens, stablecoins, tokenized stocks (from 2026), and anything whose price did not move.
Top 50. On the first day of each month, coins are ranked by their median daily USDT volume over the previous 30 days. A coin must have traded on at least 20 of those days. Trading volume stands in for market cap and is known on the day of ranking, so nothing is chosen with hindsight.
Index. Buy the 50 at the previous day's close, equal weight (or weighted by ranking volume), and hold them to the next month. A coin that stops trading mid-month is held at its last price. In reality it would usually be sold lower before delisting, so the real result was a little worse.
Token swaps (e.g. MATIC to POL, RNDR to RENDER, the AGIX/OCEAN to FET merger, 16 in all) are followed into the new token, so a rename does not count as a death.
No fees, except on the "net" line in the data file: 0.4% on the share of the basket that changes at each rebalance. No staking income, no airdrops.