The S&P 500 and its equal-weight twin: the lowest correlation in 100 years
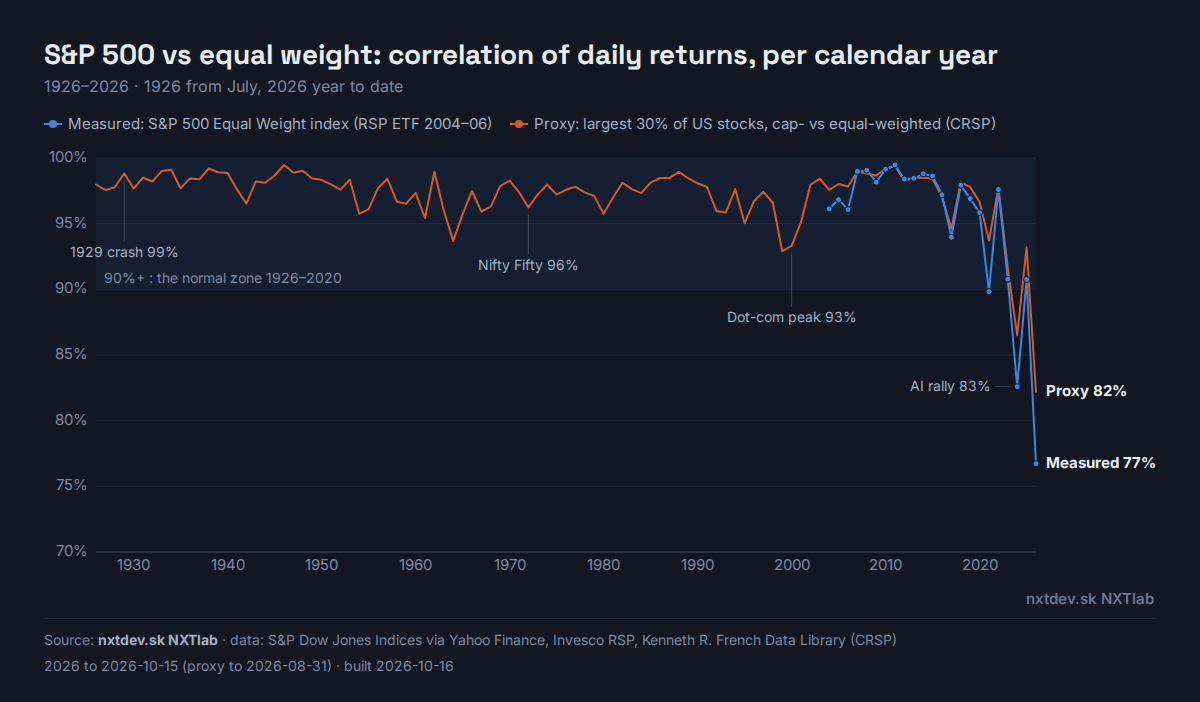
In 2026 the S&P 500 and its equal-weight index are only 77% correlated: the lowest in 100 years.
For almost a century the cap-weighted and the equal-weighted US large-cap market moved as one: from 1926 to 2020 the daily-return correlation never fell below 93%, through the Depression, the Nifty Fifty and the dot-com bubble. Since 2021 the measured index has been below that old low in five of six years.
Equal weight is now US stocks with little AI in them
Take the AI trade to be the 12 largest AI-linked companies (). They are worth about $ trillion, over 40% of the S&P 500. In the equal-weight index every company gets the same slot, so the same 12 are only about 2.5% of it after each quarterly rebalance; the other ~97.5% is the rest of the US market. With the correlation at its lowest on record, the equal-weight index has become a fairly clean way to own US stocks with little AI.
A correlation this low needs two things at the same time:
Concentration. The AI block is over 40% of the cap-weighted index and 2.5% of the equal-weight one, so the two indices hold very different things.
The rest of the market moves differently from AI. Either one alone is not enough: heavy leaders that move with everything else would still track equal weight, and a block that moves on its own but is small would barely register.
What it does not mean:
Little AI, not no AI. The other 490 include AI suppliers (power utilities, data-centre landlords, grid and cooling equipment, chip equipment), and the equal-weight index still moves about of the AI block's daily move.
Not a way to earn more by itself. Equal weight lagged the S&P 500 in 2023, 2024, 2025 and so far in 2026.
No protection from a recession. In broad sell-offs everything falls together and equal weight has fallen more: −41% vs −39% in 2008, −39% vs −34% in the 2020 crash. That is a job for bonds (US Treasuries gained 18–34% in 2008), except in an inflation shock like 2022, when they fell too.
Where it does help: if AI demand cools and the leaders fall on their own. In 2022, when the big tech names fell hardest, equal weight lost 13% and the S&P 500 19%. It softens the fall relative to the S&P 500; it does not stop it.
S&P 500 vs equal weight: correlation of daily returns, per calendar year
Measured: S&P 500 Equal Weight index (RSP ETF 2004–06)Proxy: largest 30% of US stocks, cap- vs equal-weighted (CRSP)
Source: nxtdev.sk NXTlab · data: S&P Dow Jones Indices via Yahoo Finance, Invesco RSP, Kenneth R. French Data Library (CRSP)
Measured: S&P 500 ÷ S&P 500 Equal Weight index, priceProxy: largest 30% of US stocks, cap- ÷ equal-weighted, total return (CRSP)
Month-end, log scale. Rising line: the cap-weighted index is beating equal weight. The measured line is drawn on the proxy's scale from its first month.
The same race the other way up: S&P 500 Equal Weight ÷ S&P 500
Measured: S&P 500 Equal Weight ÷ S&P 500 index, priceProxy: largest 30% of US stocks, equal- ÷ cap-weighted, total return (CRSP)
Month-end, log scale. Rising line: equal weight is beating the cap-weighted index; 100 → 400 means equal weight grew 4× as much. The measured line is drawn on the proxy's scale from its first month.
Why the line fell for 90 years
Over the century neither index lost money. The line falls when equal weight compounds faster than the S&P 500, and it did so by about 2% a year from 1926 to 2015 (proxy, total return): equal weight ended up worth roughly 6× more. The fall came in two bursts, not as a steady slide.
Why equal weight usually wins
Reason
How it works
Size tilt
Company #400 gets the same weight as the largest one. Smaller, riskier firms have historically earned more (the size premium), partly as pay for that risk.
Value tilt
Cap weighting puts the most money into whatever has already risen most, so it is overweight expensive stocks. Equal weight ignores price, so it holds more of the cheaper names.
Rebalancing
Every quarter it sells some winners and buys losers. With single stocks swinging around 30% a year, that adds roughly 1–2% p.a. while leadership keeps rotating.
Leaders fade
The biggest companies rarely stay the biggest (GE, Exxon, Cisco, IBM). Today's top 10 has historically lagged over the following decade, and cap weight holds most in them.
Higher beta
Equal weight moves about 1.1× the market. Over decades of rising prices that compounds into extra return; it also means bigger falls in crashes.
So why does almost everyone own the S&P 500?
If equal weight earned more over a century, why is nearly all index money cap-weighted? Five reasons, and the first one settles it.
Not everyone can own equal weight. The cap-weighted index is simply the whole market: it holds every company in proportion to what it is worth, which is exactly what all investors together own. Equal weight puts as many dollars into company #500 as into Apple, so it holds more of the small companies than exist for the average investor. For one investor to be overweight them, someone else must be underweight. Equal weight is a bet against the average investor; it cannot be everyone's default, while cap weight can.
It does not scale. Trillions of dollars track the S&P 500. Cap weight can absorb any amount, because each company gets money in proportion to its size. If that money went equal weight, it would have to buy as much of the smallest member as of the largest, more than those companies' shares can take.
Costs. S&P 500 funds charge about 0.03–0.07% a year; equal-weight funds about 0.20%. Equal weight also trades about a quarter of the portfolio a year to rebalance, against a few percent for cap weight. The proxy above has no costs, so the real-world edge was roughly 0.3–0.5 points a year smaller.
Recent history. The real equal-weight fund only exists since 2003, and over its whole life it has lost to the S&P 500, by about 2.5–3 points a year since 2015. Most investors judge by the last ten years.
The S&P 500 is the yardstick. Fund managers and advisers are measured against it. Owning something else and lagging it for ten years can cost them clients or their job, so even those who believe in equal weight hold little of it.
None of this makes equal weight a mistake. Its extra return is pay for carrying more risk (smaller and cheaper companies, about 1.1× the market's swings), it can lag for a decade or more, and it works best as a bet against an unusually top-heavy index, like the one today.
Regimes: when the S&P 500 wins, when equal weight wins
Change in the S&P 500 ÷ equal-weight ratio over each episode, CRSP proxy (measured index in brackets where it exists). Positive: the S&P 500 won.
Small and cheap names priced for disaster rebound hardest. Most of equal weight's century of gains came here.
After a mega-cap bubble bursts
Equal weight
2000–02 −17%; 2002–07 −19%
The bubble stocks deflate; the rest of the market was cheap all along.
Rate shock that hits expensive growth
Equal weight
2022 −4% (−7%)
Long-duration, high-valuation leaders fall hardest when rates jump.
Calm, broad market, leadership rotating
Equal weight, slowly
1946–99 −0.4% p.a.
Rebalancing and the size/value tilts add a little every year.
What to watch for each
Lean S&P 500 when…
Lean equal weight when…
The leaders' earnings keep growing fast enough to justify their weight
The leaders' valuations stretch well ahead of their earnings
A recession or crash is under way and has not bottomed
A crash has bottomed and the recovery is starting
You want the lowest cost and turnover
The ratio is near a historical high (as in 2000 and today) and you are willing to wait years
You want the AI trade at full weight
You want US stocks with little AI in them, as a diversifier next to AI exposure held elsewhere
Two cautions. The regimes are only clear in hindsight; turning points (2000, 2009) were not obvious at the time, and cap weight can keep winning for a decade, as since 2015. And the proxy line is before costs: RSP charges 0.20% a year and trades more, so the real-world gap was somewhat smaller than drawn.
The numbers
Key periods
Long proxy (CRSP), yearly correlation; measured index where it exists
By decade
Long proxy (CRSP); 1920s = 1926–29, 2020s = 2020–26 to date
Data table, every year
What it shows
A century of near-lockstep. From 1926 to 2020 the yearly correlation on the long proxy stayed between 93% and 99.5%; the decade averages were 96–99%.
The famous bubbles barely moved it. 1929–32 crash: 98–99%. Nifty Fifty, 1972–73: 96–97%. The dot-com peak, 1999–2000: 93%, the lowest of the century until recently.
Low years are narrow bull markets. Since 1990 the dips are 1995, 1999–2000, 2017, 2021 and 2023–2026: years when a small group of large stocks led and the rest did not follow.
Crashes push it back toward 99%. In 1929–32, 1987, 2002, 2008, 2011 and 2022 everything fell together. A low correlation describes a calm, divided market; it does not survive a broad sell-off.
The 2020s are new territory. Four of the five lowest years since 1926 are 2023–2026. On the proxy, 2026 is at 82% and 2024 was 87%, against a previous record low of 93%. The measured index is lower still: 83% in 2024, 77% in 2026.
It is no longer a one-off. Five of the last six years were below 91% on the measured index. Earlier, a low year was followed by a normal one.
Why it matters
The S&P 500 is now roughly two different things: a heavy block of AI-led mega caps and 490 other companies. The equal-weight index is almost entirely the second part. When the two blocks stop moving together, the cap-weighted index looks calm because its parts offset each other, and the equal-weight index becomes a real diversifier again. That diversification helps most if the mega-cap block falls on its own; in a broad recession or credit crash the equal-weight index has historically fallen more (2008, 2011, 2020).
Method
Correlation of daily returns between a cap-weighted and an equal-weighted large-cap series, computed separately for each calendar year (about 250 trading days each; 1926 from July).
Measured: the S&P 500 against the S&P 500 Equal Weight index from 2007, and against the Invesco RSP ETF for 2004–2006 (2003, its launch year, is left out).
Proxy, for every year since 1926: the largest 30% of US stocks (NYSE size breakpoints), cap-weighted against the same stocks equal-weighted, both from the Kenneth R. French Data Library (CRSP data). Before 1962 CRSP covers NYSE stocks only. The cap-weighted leg tracks the S&P 500 at 99%+ from 1962. It reads higher than the measured index in the years when the two split (by about 4–5 points in 2024 and 2026), so the true values in such years were probably a little lower than shown.
Why not the S&P 500 itself before 1962: its early daily series does not line up day by day with CRSP (the NYSE also traded on Saturdays until 1952), which would show data noise as low correlation. Both proxy legs come from one source, so they share the same days.
Dividends are left out; they move daily correlation by a negligible amount.
AI block: the 12 companies above, one daily return series weighted by market value on the build day, from Yahoo Finance. Today's members and weights are used for every year, so the table reads as "how much did the indices move with today's AI leaders", not as a history of the AI trade. Index returns quoted are price returns; the Treasury figures (IEF, TLT ETFs) include interest.